 Electrocreativity
In this blog, we will see how to plot a rolling graph on an OLED display. For this tutorial, we will use a 0.96" OLED display with an SSD1306 driver. We will use Arduino, but the algorithm is the same for other controllers.
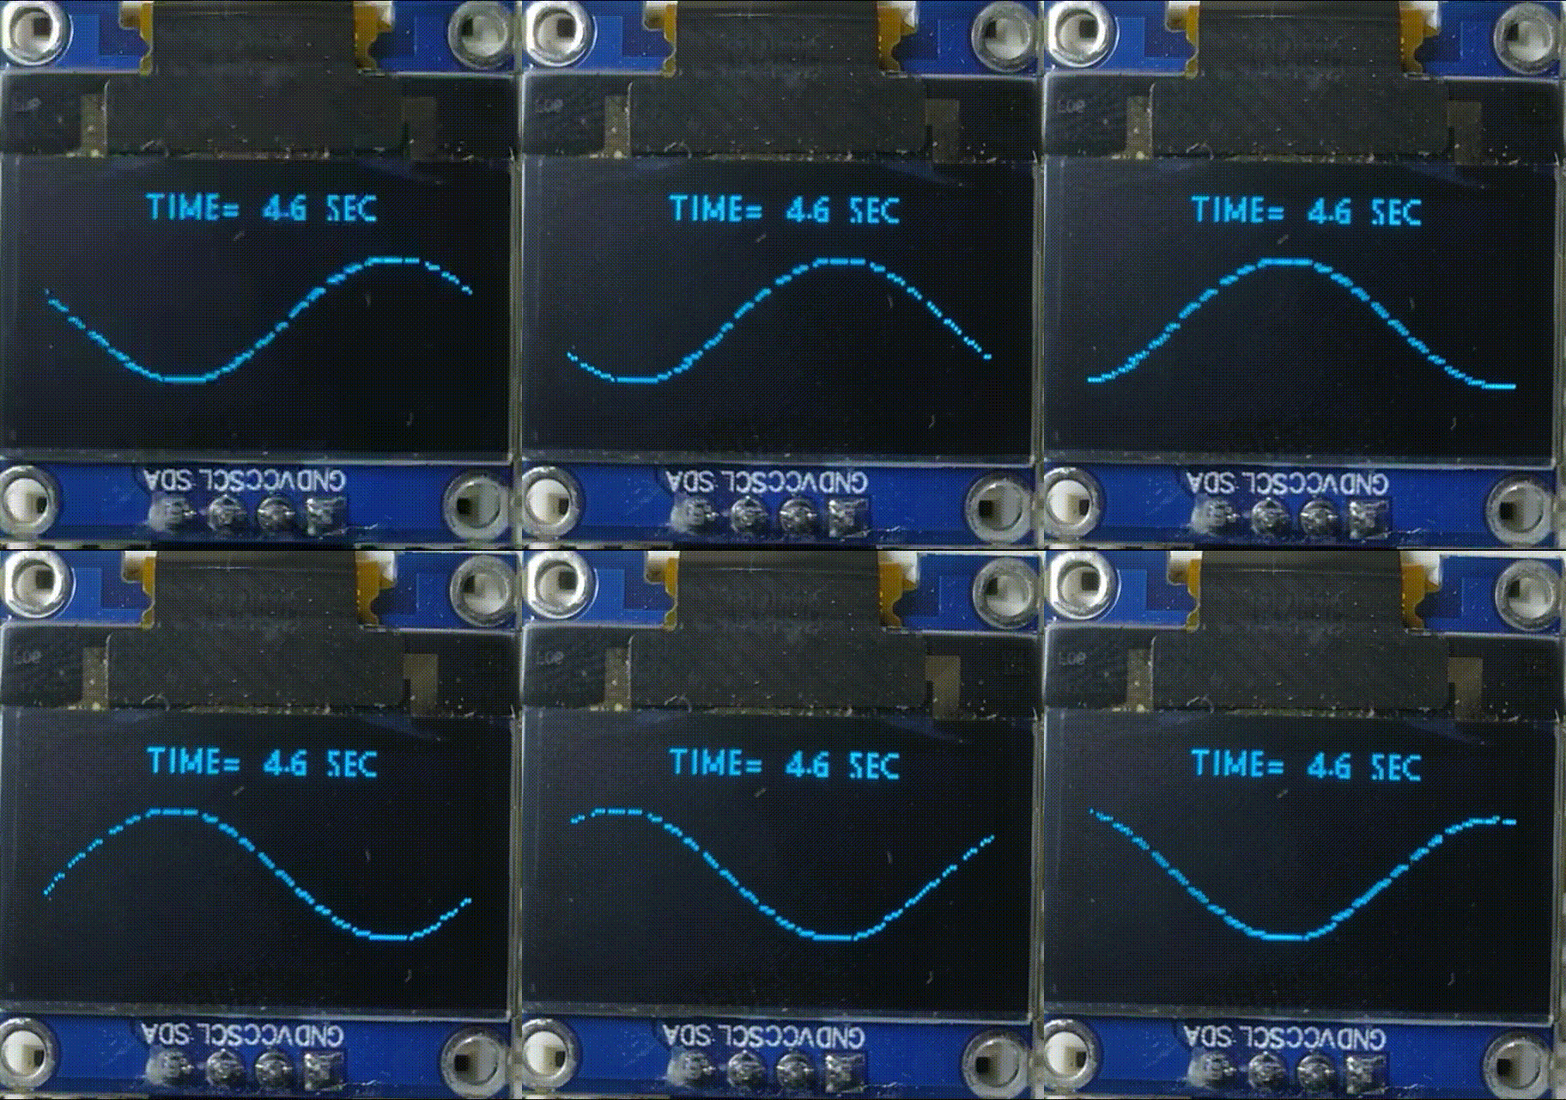
Single sine wave output
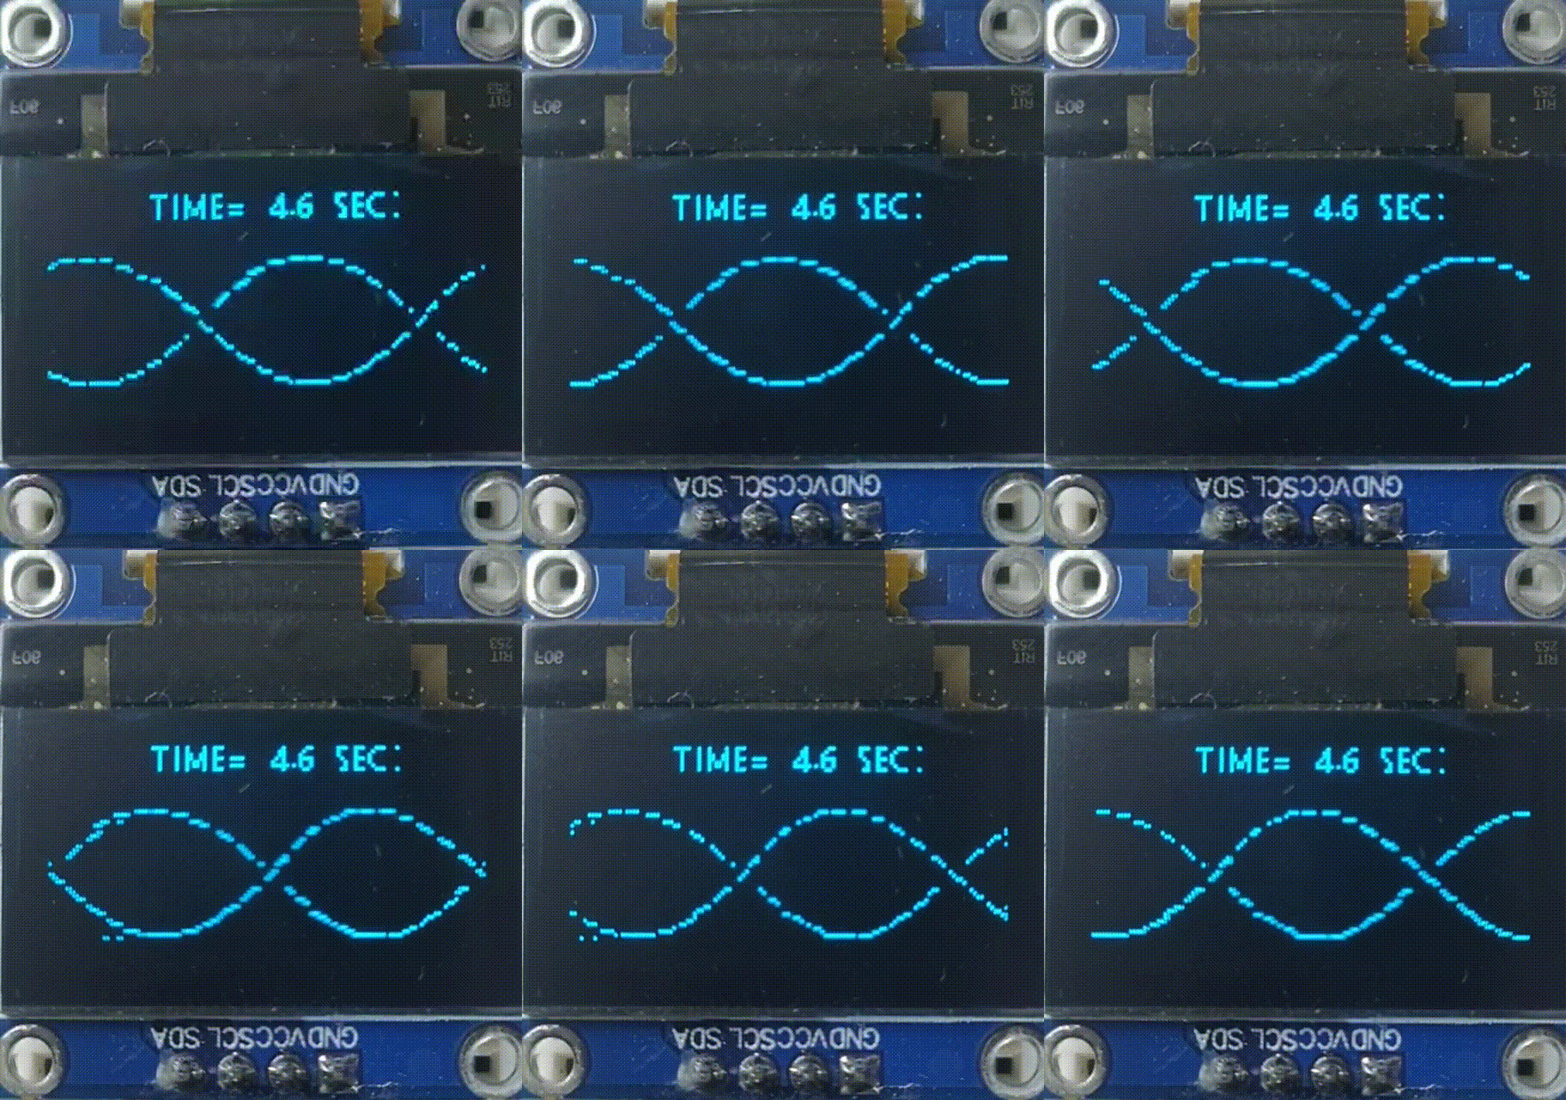
Rolling sine wave displayed on 0.96" OLED
▶ Watch the video tutorial on YouTube
Basics
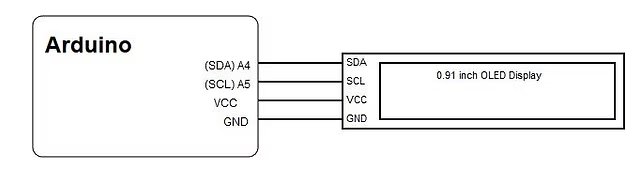
Let's start from the basics. The 0.96" OLED has 128×64 pixels. It has one special feature: the ability to scroll/roll display content from left to right and right to left. This feature is very useful for plotting a rolling graph.
Because of this, we need to plot only one point on the rightmost pixel column, and then that point is rolled by the display driver from right to left — without needing the controller to do any shifting.
Calculating Time Interval
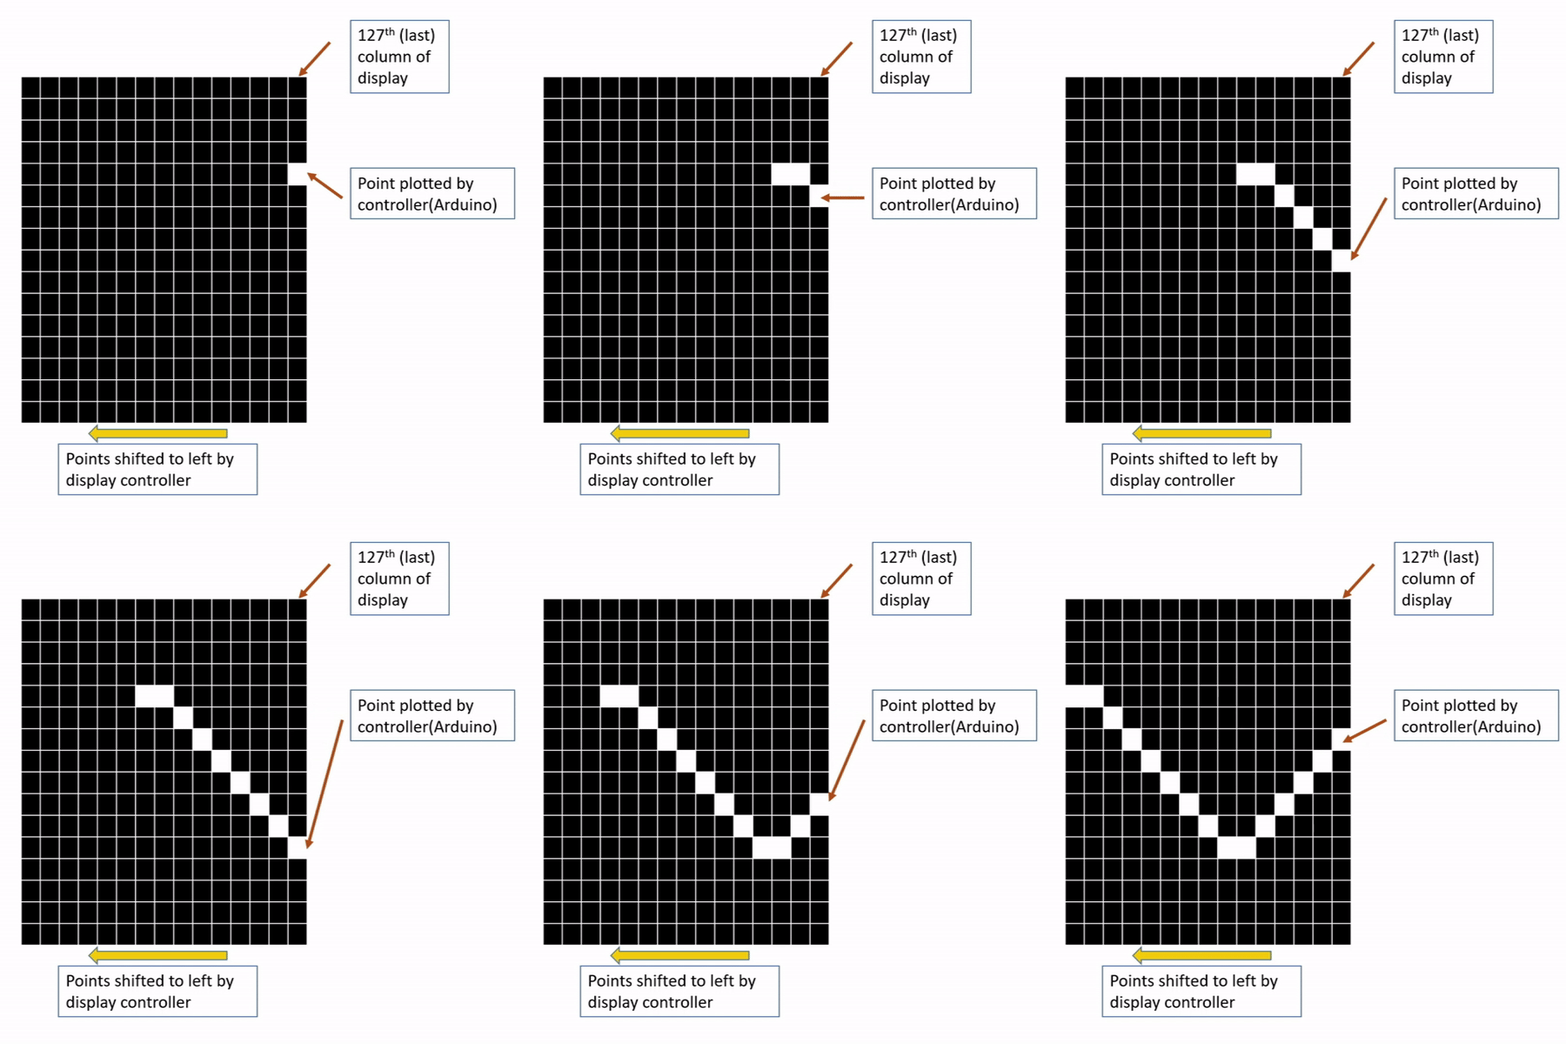
Pixels added and rolling on the screen
In the OLED display, we can set the rolling speed to 8 levels (0 to 7). Consider we want to draw a rolling sine wave on the display. First, we plot a single pixel on the right-most pixel column. Then this pixel column is shifted left by the display controller. Then we need to plot the next point on the same rightmost pixel column.
But for that, we need to know how much time it takes to shift by one pixel for all 8 levels of speed. The following code is used to measure the time taken by a single pixel to shift by one pixel to the left.
void setup() {
  Serial.begin(9600);
  oled_begin();
  set_pixal(0, 32);
  scrollLeft(0x00, 0x07, 0x07);
}
Output of above code:
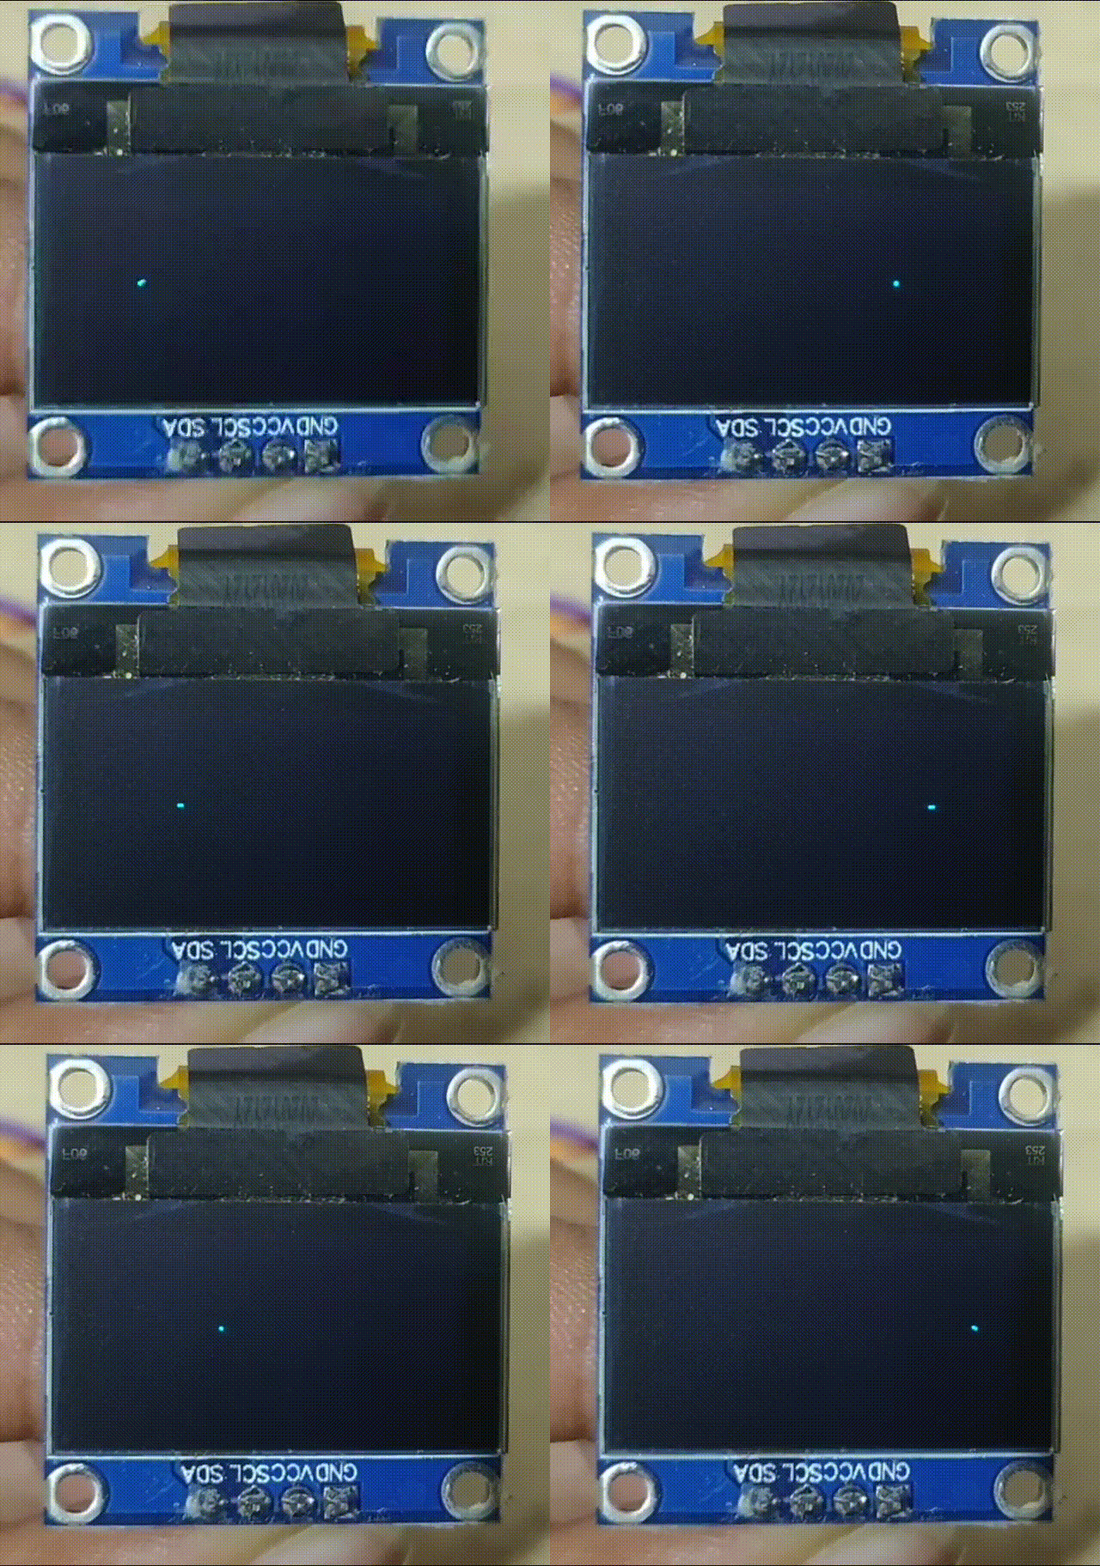
A single pixel traveling from right to left
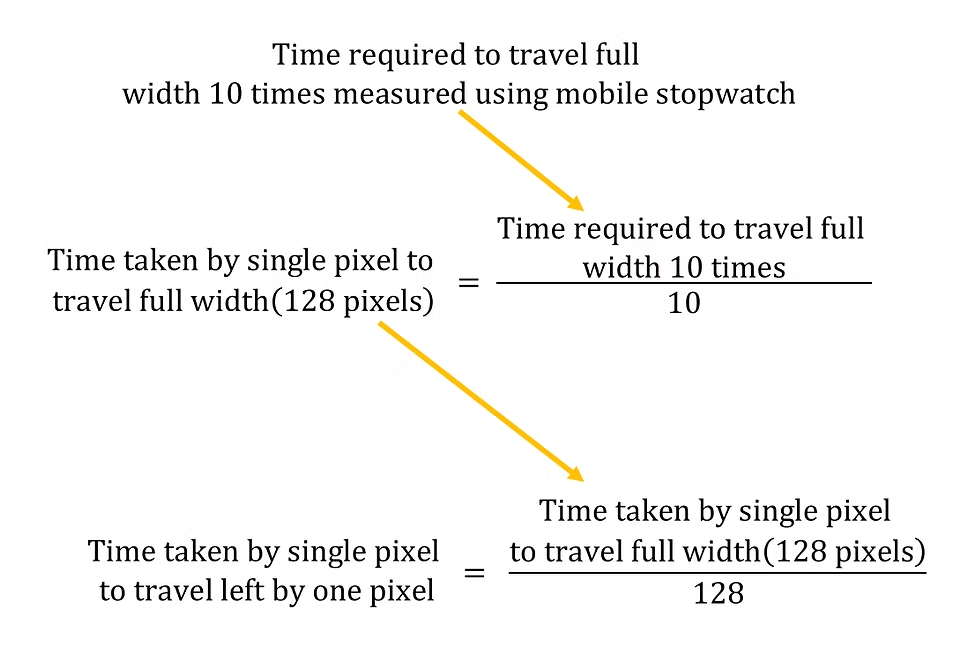
To measure the time accurately: measure the time required for a single pixel to travel the full width (128 pixels) 10 times, then divide by 10 to get the average time for single-width travel with less error. Dividing by 128 gives the time for a single pixel shift (ΔT).
Speed vs. Timing Table
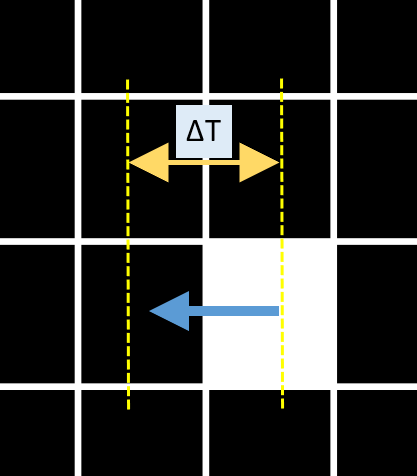
Time taken for pixel shift at each speed level
| Speed Level | T1 (10× width) sec | T2 = T1/10 sec | ΔT = T2/128 ms |
|---|---|---|---|
| 7 | 23 | 2.3 | 18 |
| 4 | 35 | 3.5 | 27.3 |
| 5 | 46 | 4.6 | 36 |
| 6 | 57.5 | 5.75 | 45 |
| 0 | 70 | 7 | 54.7 |
| 1 | 370 | 37 | 289 |
| 2 | 740 | 74 | 586 |
| 3 | 1480 | 148 | 1156 |
Now we have the time intervals. Here's the key data arrays used in code:
byte select_speed[] = {3,2,1,0,6,5,4,7};
int  sampling_period[] = {1150,580,280,50,40,33,24,14};
float TimeScale[] = {148,74,37,7,5.75,4.6,3.5,2.3};
The set_pixal() Function
The set_pixal() function lights up an individual pixel at a given
(x, y) coordinate. Our rolling plot is made from such single pixels.
void set_pixal(byte x_cord, byte y_cord)
{
  byte x_mod, y_mod, pixel_location, data, y_mod_page;
  y_cord = 63 - y_cord;
  x_mod = x_cord;
  y_mod_page = (y_cord) / 8;
  pixel_location = y_cord % 8;
  data = 0B00000001 << pixel_location;
  setCursor(x_mod, y_mod_page);
  writeData(data);
}
Timer Interrupt
We need to put a pixel on the rightmost pixel column at specific intervals of time — and this interval must be followed accurately.
- If a new pixel is put before the previous data shifts left → pixel overlap
- If a new pixel is put after the interval → blank column (discontinuous graph)
This mismatch in sampling time causes an unwanted out-of-phase sine wave to appear alongside the intended wave:
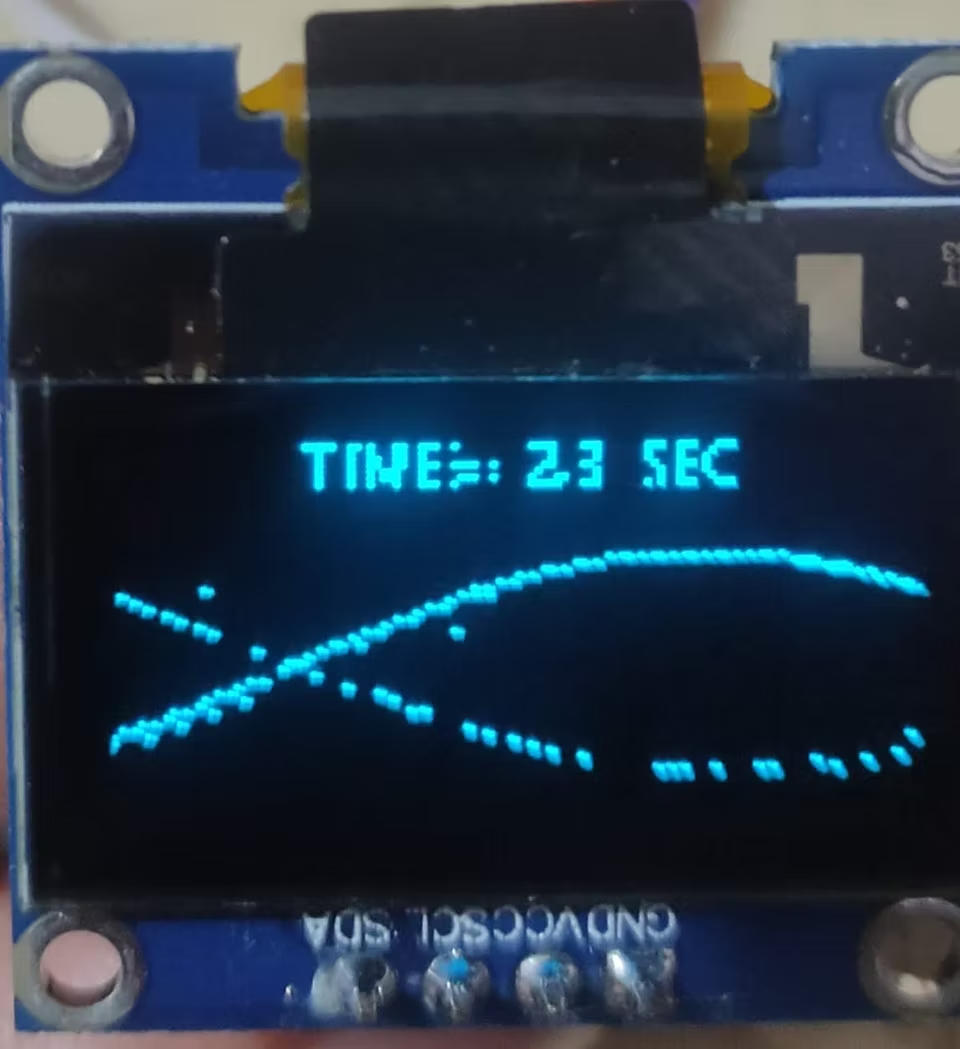
Wrong sampling → out-of-phase wave
To achieve accurate sampling, we use a Timer interrupt — specifically MsTimer2. (Timer1 cannot be used when the I2C bus is active for the display.)
Code Flow
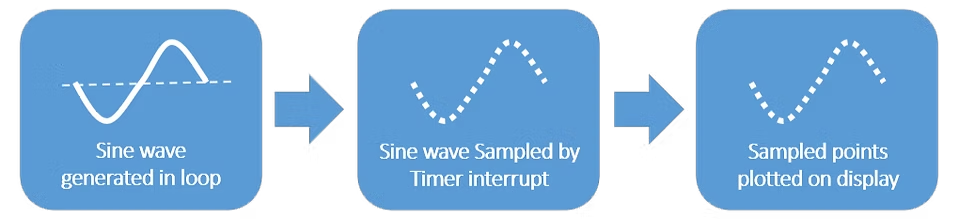
Code flow diagram
Just to keep things simple, the sine wave is generated in the controller
(Arduino) itself using the formula x = A·sin(2πt/T) + offset.
A count variable holds the current sample value, set by the timer interrupt,
then plotted using set_pixal().
// setup function and OLED configuration functions not shown here

void timerIsr() // Timer interrupt function
{
  get_sample = true;
}

void loop() {
  float seconds = millis() / 1000.0;

  // Sine wave generated in count variable
  // Formula: x = A sin(2πt/T) + offset
  count = 18 * sin(2 * PI * (seconds / 4.6)) + 28;

  if (get_sample) // get_sample is set TRUE by timer interrupt
  {
    // First clear the column
    for (byte i = 1; i < 8; i++)
    {
      setCursor(127, i);
      writeData(0x00); // clear the column of 8 pixels
    }
    // Now plot the point
    set_pixal(127, count);
    get_sample = false;
  }
}
Output
Single sine wave output (Time = 4.6 sec full width)
Adding Multiple Waves
We can add multiple waves by calling set_pixal() for each wave:
//Sine wave generated in count variable
//Formula : x = A sin(2πt/T)+ offset
  count = 18 * sin(2 * PI * (seconds / 4.6)) + 28; //wave 1
  count2 =18 * sin(PI+2*PI*(seconds/4.6))+ 28;     //wave 2
            .
            .
            .
  set_pixal(127, count);    //wave 1
  set_pixal(127, count2);   //wave 2
            .
            .
            .
Final result — rolling graph on OLED (Time = 4.6 SEC = full display width)
In the above image, Time = 4.6 SEC is the time scale for the full display width.
Download Arduino Code
Download Arduino Code from GitHubIn this way we can display any signal on the OLED display. Please let me know your thoughts in the comment section!
Comments